
@TOC
一、概述
监控作为运维中一个重要环节,可以减少不必要运维工作,更好的维护客户资源,这里采用:
Prometheus(普罗米修斯):作为主要存储提取数据工具
Grafana:用于数据页面的展示
node_exporter :linux服务器性能采集器,
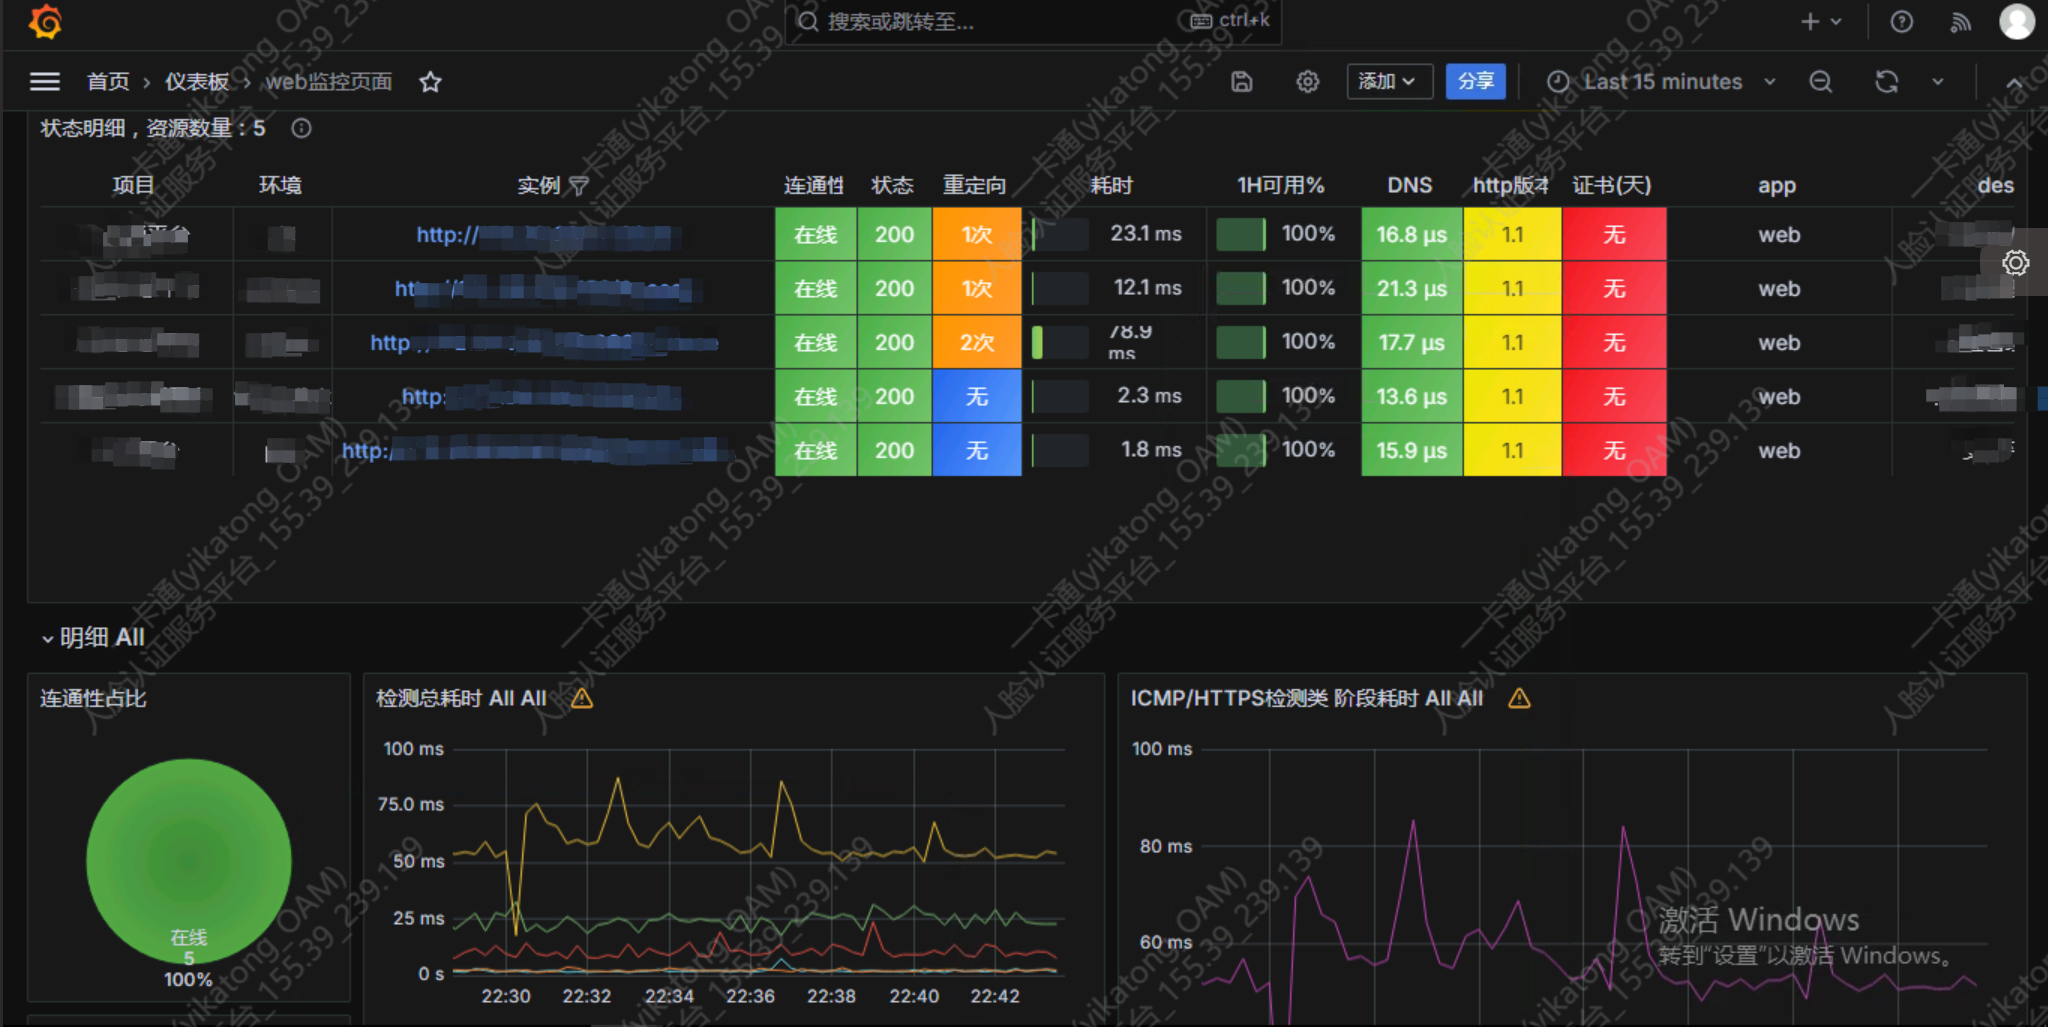
blockbox:web页面状态监控
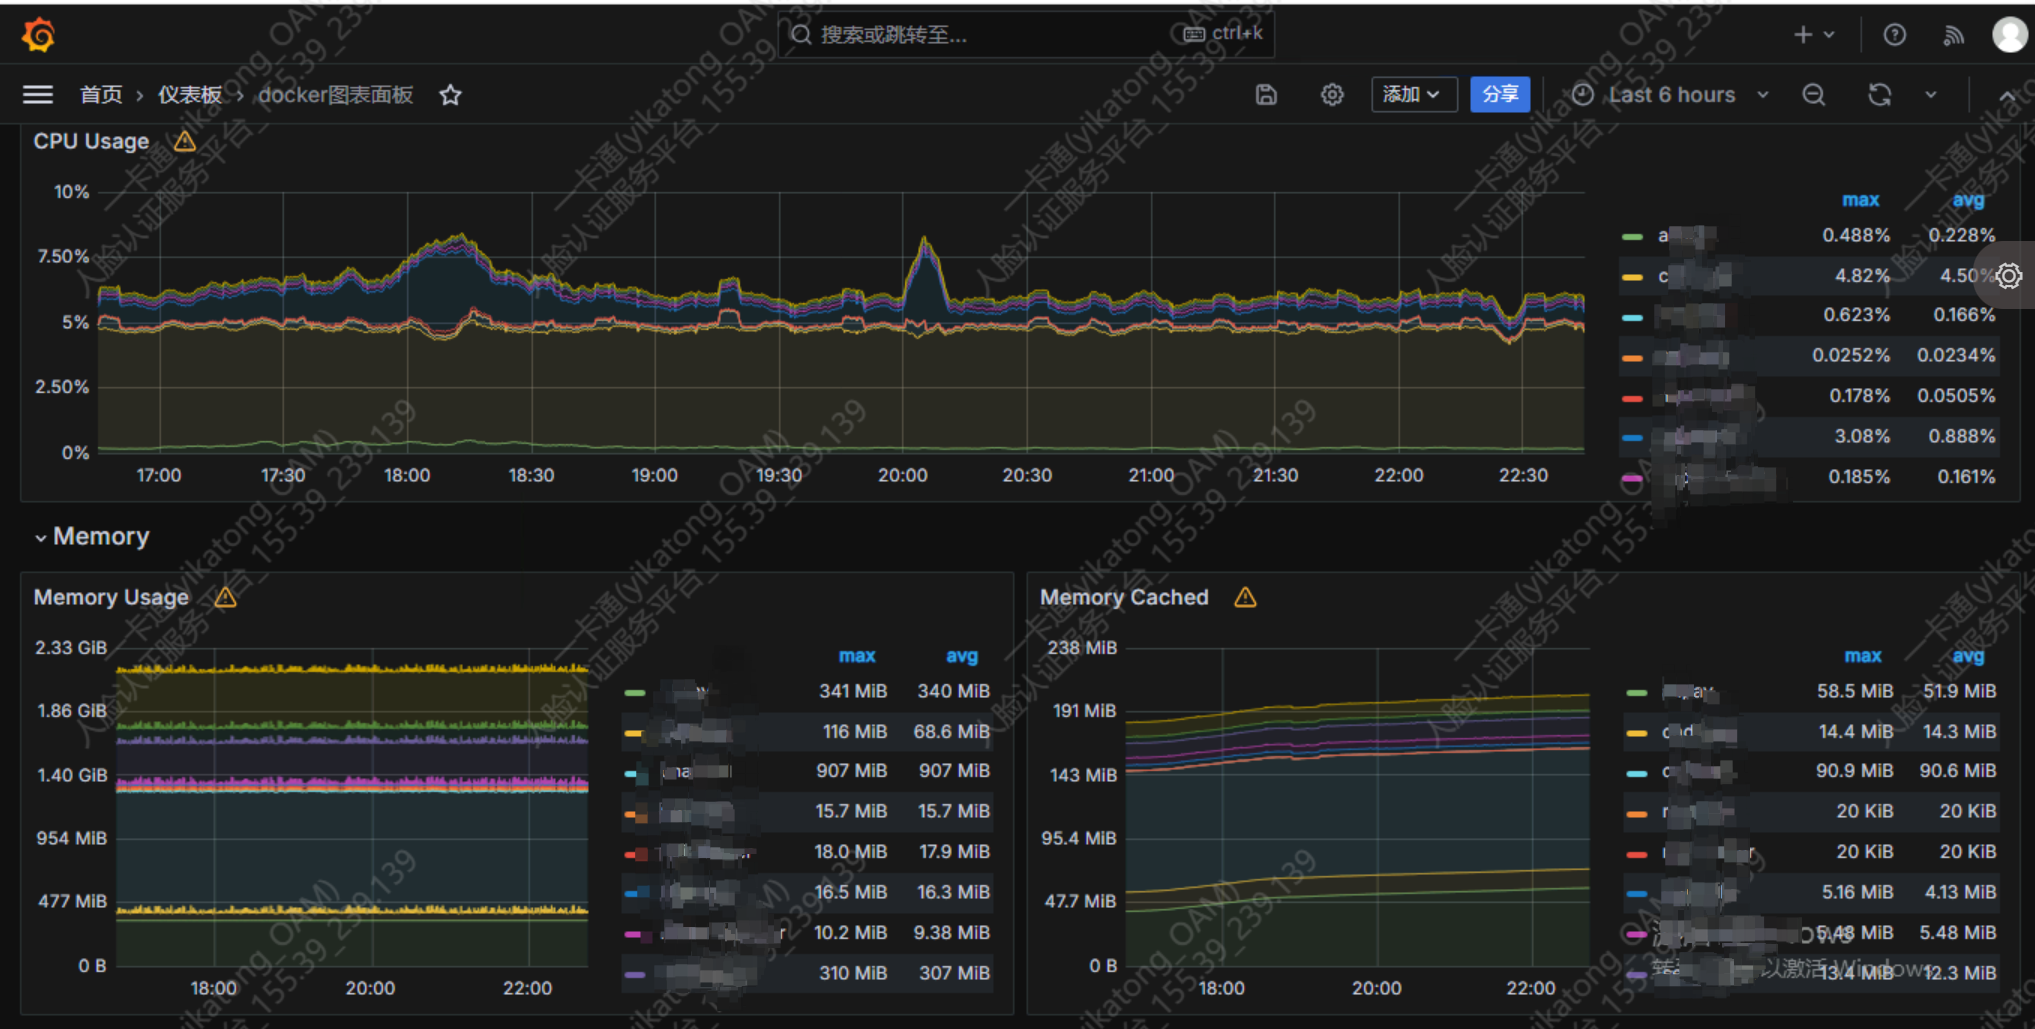
cadvisor:容器数据的监控采集
alertmanager:发送告警信息
dingtalk:发送到钉钉告警群,使用webhook
以下是linux服务器监控、web页面监控、docker容器监控、windows服务器监控

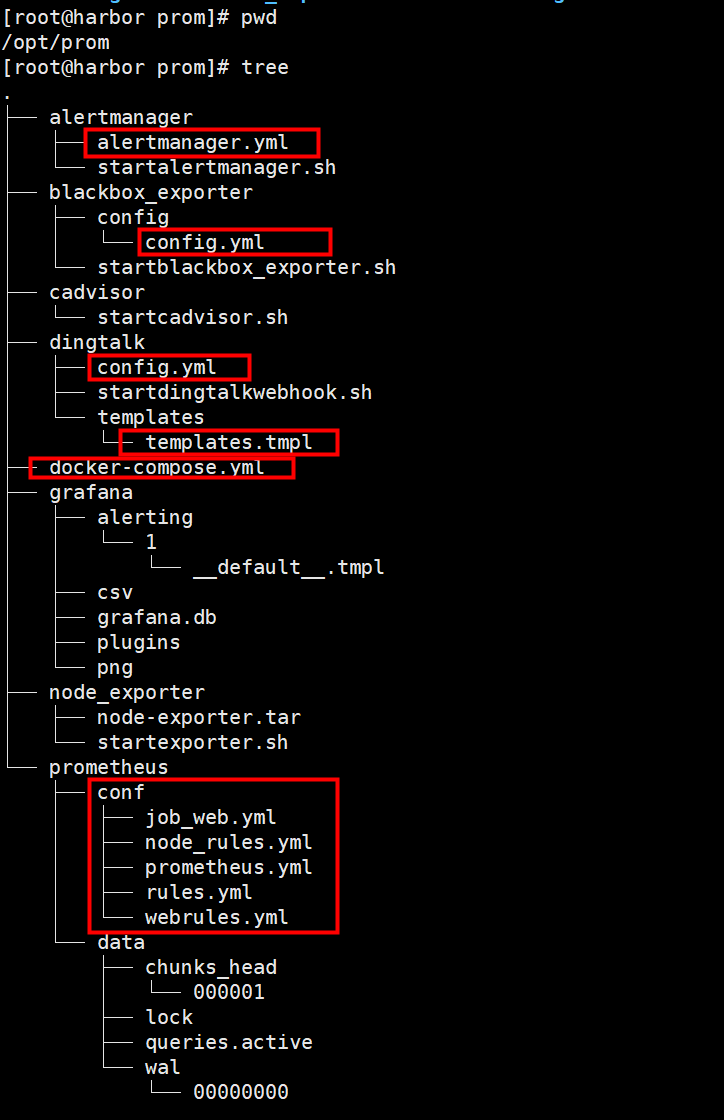
二、目录结构
三、准备工作
3.1 新建目录
#新建本地目录
mkdir -p /opt/prom/{prometheus/data,prometheus/conf,blackbox_exporter/config,alertmanager,grafana,dingtalk}

#授权目录
chmod 777 /opt/prom/{prometheus/data,prometheus/conf,blackbox_exporter/config,alertmanager,grafana,dingtalk}
3.2 拷贝对应yml文件到各自文件夹
3.3 执行docker-compose up -d拉取镜像启动
四、文件
docker-compose.yml
version: '3.3'

services:
  node-exporter:
    image: prom/node-exporter:latest
    ports:
      - "9100:9100"         #node-exporter默认端口9100,不过由于metersphere的node-exporter已经占用了9100了,这里调整为9101
    networks:
      - prom

  dingtalk:
    image: timonwong/prometheus-webhook-dingtalk:latest
    volumes:
      - type: bind
        source: ./dingtalk
        target: /etc/prometheus-webhook-dingtalk
        read_only: true
    ports:
      - "8060:8060"
    networks:
      - prom

  alertmanager:
    depends_on:
      - dingtalk
    image: prom/alertmanager:latest
    volumes:
      - type: bind
        source: ./alertmanager/
        target: /etc/alertmanager/
        read_only: true
    ports:
      - "9093:9093"
    networks:
      - prom

  blackbox-exporter:
    image: prom/blackbox-exporter:master
    volumes:
      - type: bind
        source: ./blackbox_exporter/config/
        target: /etc/blackbox_exporter/
        read_only: true
    ports:
      - '9115:9115'
    networks:
      - prom

  cadvisor:
    image: 'registry.cn-beijing.aliyuncs.com/luohuiwen20/cadvisor:v0.47.0'
    devices:
      - /dev/kmsg
    privileged: true
    ports:
      - '8089:8080'
    volumes:
      - '/dev/disk/:/dev/disk:ro'
      - '/var/lib/docker/:/var/lib/docker:ro'
      - '/sys:/sys:ro'
      - '/var/run:/var/run:ro'
      - '/:/rootfs:ro'
    networks:
      - prom

  prometheus:
    depends_on:
      - alertmanager
    image: prom/prometheus:latest
    volumes:
      - type: bind
        source: ./prometheus/conf
        target: /etc/prometheus/
        read_only: true
      - type: volume
        source: prometheus
        target: /prometheus
    ports:
      - "9200:9090"         #prometheus默认端口9090,不过ms-prometheus占用该端口,这里换成9200
    networks:
      - prom

  grafana:
    depends_on:
      - prometheus
    image: grafana/grafana:latest
    volumes:
      - type: volume
        source: grafana
        target: /var/lib/grafana
    ports:
      - "3000:3000"
    networks:
      - prom

volumes:
  prometheus:
    driver: local
    driver_opts:
      type: none
      o: bind
      device: /opt/prom/prometheus/data
  grafana:
    driver: local
    driver_opts:
      type: none
      o: bind
      device: /opt/prom/grafana

networks:
  prom:
    driver: bridge
prometheus.yml
global:
  scrape_interval: 15s # Set the scrape interval to every 15 seconds. Default is every 1 minute.
  evaluation_interval: 15s # Evaluate rules every 15 seconds. The default is every 1 minute.
  # scrape_timeout is set to the global default (10s).

# Alertmanager configuration
alerting:
  alertmanagers:
    - static_configs:
        - targets: [ 'localhost:9093' ]

# Load rules once and periodically evaluate them according to the global 'evaluation_interval'.
rule_files:
  - "/etc/prometheus/rules.yml"
  - "/etc/prometheus/webrules.yml"
  - "/etc/prometheus/node_rules.yml"
# - "first_rules.yml"
# - "second_rules.yml"

# A scrape configuration containing exactly one endpoint to scrape:
# Here it's Prometheus itself.
scrape_configs:
  # The job name is added as a label `job=<job_name>` to any timeseries scraped from this config.
  - job_name: 'prometheus'
    static_configs:
      - targets: [ 'localhost:9100' ]   #node_expoert地址
        labels:
           instance: prometheus


  - job_name: 'http_status'  # 配置job名
    metrics_path: /probe     # 定义metric获取的路径
    params:
      module: [http_status]     # 这里就是我们在black_exporter中定义的模块名
    file_sd_configs:         # 因需要监控的地址很多,我们这里将所有地址独立出来,后面会介绍该文件
      - files:
        - '/etc/prometheus/job_web.yml'
        refresh_interval: 30s # 30秒刷新一次,当有新的监控地址时,会自动加载进来不需要重启
    relabel_configs:
      - source_labels: [__address__]  # 当前target的访问地址,比如监控百度则为 https://baidu.com
        target_label: __param_target  # __param是默认参数前缀,target为参数,这里可以理解为把__address__ 的值赋给__param_target,若监控百度,则target=https://baidu.com
      - source_labels: [__param_target]
        target_label: instance        # 可以理解为把__param_target的值赋给instance标签
      - target_label: __address__
        replacement: 172.20.239.123:9115 # web监控原本的target为站点的地址,但Prometheus不是直接去请求该地址,而是去请求black_exporter,故需要把目标地址替换为black_exporter的地址
  - job_name: containers
    scrape_interval: 5s
    static_configs:
      - targets: [ 'localhost:8089' ]
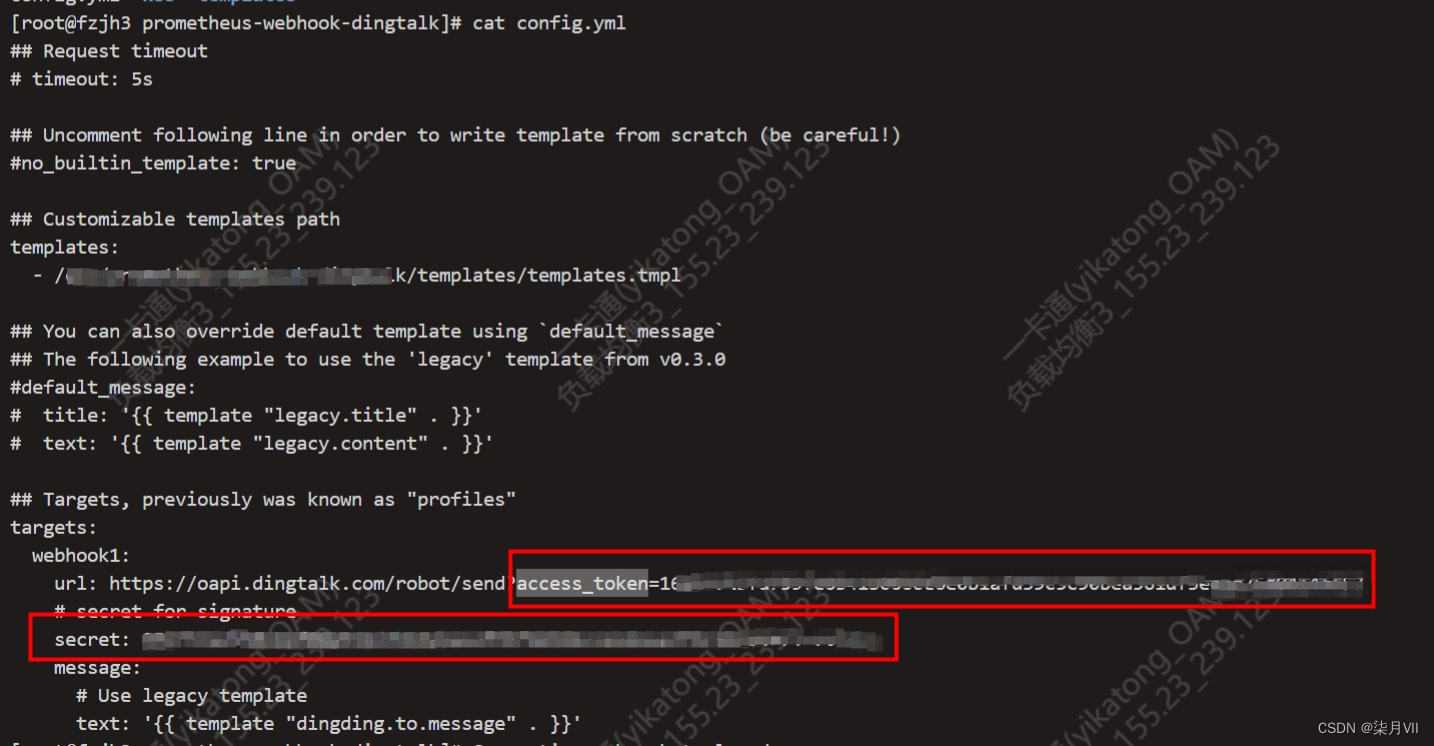
config.yml
dingtalk配置文件
## Request timeout
# timeout: 5s

## Uncomment following line in order to write template from scratch (be careful!)
#no_builtin_template: true

## Customizable templates path
templates:
  - /opt/prom/templates/templates.tmpl   #模版文件

## You can also override default template using `default_message`
## The following example to use the 'legacy' template from v0.3.0
#default_message:
#  title: '{{ template "legacy.title" . }}'
#  text: '{{ template "legacy.content" . }}'

## Targets, previously was known as "profiles"
targets:
  webhook1:
    url: https://oapi.dingtalk.com/robot/send?access_token=xxxxxxxxxxx
    # secret for signature
    secret: xxxxxxxxxxxxxxxxxxxxxxxxxxxx
    message:
      # Use legacy template
      text: '{{ template "dingding.to.message" . }}'
alertmanager.yml
global:
  resolve_timeout: 5m

route: # 告警路由配置,定义如何处理和发送告警
  receiver: webhook
  group_wait: 30s
  group_interval: 1m
  repeat_interval: 4h
  group_by: [alertname]
  routes:
  - receiver: webhook
    group_wait: 10s

receivers: # 告警接收者配置,定义如何处理和发送告警
- name: webhook
  webhook_configs:
  - url: http://localhost:8060/dingtalk/webhook1/send  # 告警 Webhook URL
    send_resolved: true # 是否发送已解决的告警。如果设置为 true,则在告警解决时发送通知
config.yml
blockbox配置文件
modules:
  http_status:      # 给模块取名,后面在Prometheus的配置文件中会用到该名称
    prober: http # 探针类型,探针有多种类型如http、tcp、icmp、dns,不同的探针具有不同的功能
    timeout: 5s  # 探针检测超时时间
    http:
      valid_status_codes: [] # 有效的状态码,默认为200,也可以自己定义,比如你的站点304也可能是正常的
      method: GET            # http使用get请求
      fail_if_body_not_matches_regexp: [] # 对返回结果进行正则匹配,如果未匹配成功则认为失败
      tls_config:
        insecure_skip_verify: true        # 不安全的https跳过确认,如某些证书不合法或者过期,如果你在浏览器访问,那浏览器会让你确认是否继续,这里也是类似的意思。
job_web.yml
blockbox访问地址,配置在prometheus.yml里面
---
- targets:
  - https://baidu.com
  labels:
    env: baidu
    app: web
    project: 百度
    desc: 百度一下
- targets:
  - https://blog.henryplus.cn/
  labels:
    env: bolg
    app: web
    project: henry博客
    desc: henry博客欢迎访问
告警文件
rules.yml
linux
groups:
- name: 实例存活告警规则
  rules:
  - alert: 实例存活告警
    expr: up == 0
    for: 1m
    labels:
      user: prometheus
      severity: '严重'
    annotations:
      description: "[报警]:服务器无法访问或数据采集器无法访问。\n>服务器名称:{{ $labels.instance }} \n \n >服务器地址:{{ $labels.ip }}"

  - alert: 磁盘使用率告警
    expr: (node_filesystem_size_bytes - node_filesystem_avail_bytes) / node_filesystem_size_bytes * 100 > 90
    for: 1m
    labels:
      user: prometheus
      severity: '警告'
    annotations:
      description: "[报警]:Linux服务器分区使用率超过90%!(挂载点: {{ $labels.mountpoint }} 当前值: {{ $value }}%)\n>服务器名称:{{ $labels.name }} \n \n >服务器地址:{{ $labels.instance }}"

  - alert: CPU使用率告警
    expr: 100 - (avg by (instance)(irate(node_cpu_seconds_total{mode="idle"}[1m]) )) * 100 > 90
    for: 1m
    labels:
      user: prometheus
      severity: '警告'
    annotations:
      description: "[报警]:Linux服务器CPU使用超过90%!(当前值: {{ $value }}%)\n>服务器名称:{{ $labels.name }} \n \n >服务器地址:{{ $labels.instance }}"

  - alert: 内存使用率告警
    expr: (node_memory_MemTotal_bytes - (node_memory_MemFree_bytes+node_memory_Buffers_bytes+node_memory_Cached_bytes )) / node_memory_MemTotal_bytes * 100 > 90
    for: 1m
    labels:
      user: prometheus
      severity: '警告'
    annotations:
      description: "[报警]:Linux服务器内存使用率超过90%!(当前值: {{ $value }}%)\n>服务器名称:{{ $labels.name }} \n \n >服务器地址:{{ $labels.instance }}"

  - alert: Windows服务状态
    expr: windows_service_status{status="ok",exported_name!="tcpiddaservice"} != 1
    for: 1m
    labels:
      severity: '严重'
    annotations:
      description: "[报警]: Windows服务状态不正常\n>服务器名称:{{ $labels.name }}\n>服务器地址:{{ $labels.instance }} \n \n >Windows服务名称:{{ $labels.exported_name}}"

  - alert: Windows服务器磁盘使用率
    expr: 100.0 - 100 * ((windows_logical_disk_free_bytes / 1024 / 1024 ) / (windows_logical_disk_size_bytes / 1024 / 1024)) > 90
    for: 2m
    labels:
      severity: '警告'
    annotations:
      description: "[报警]: Windows服务器磁盘使用超过90%!(盘符:{{ $labels.volume }} 当前值:{{ $value }}%)\n>服务器名称:{{ $labels.name }} \n \n >服务器地址:{{ $labels.instance }}"

  - alert: Windows服务器CPU使用率
    expr: 100 - (avg by (instance) (rate(windows_cpu_time_total{mode="idle"}[2m])) * 100) > 90
    for: 0m
    labels:
      severity: '警告'
    annotations:
      description: "[报警]: Windows服务器CPU使用率超过90%!(当前值:{{ $value }}%)\n>服务器名称:{{ $labels.name }} \n \n >服务器地址:{{ $labels.instance }}"

  - alert: Windows服务器内存使用率
    expr: 100 - ((windows_os_physical_memory_free_bytes / windows_cs_physical_memory_bytes) * 100) > 90
    for: 2m
    labels:
      severity: '警告'
    annotations:
      description: "[报警]: Windows内存使用率超过90%!(当前值:{{ $value }}%)\n>服务器名称:{{ $labels.name }} \n \n >服务器地址:{{ $labels.instance }}"

- name: node_usage_record_rules
  interval: 1m
  rules:
  - record: cpu:usage:rate1m
    expr: (1 - avg(rate(node_cpu_seconds_total{mode="idle"}[1m])) by (instance,vendor,account,group,name)) * 100
  - record: mem:usage:rate1m
    expr: (1 - node_memory_MemAvailable_bytes / node_memory_MemTotal_bytes) * 100
webrules.yml
groups:

- name: Domain
  rules:
  - alert: 站点可用性
    expr: probe_success == 0
    for: 1m
    labels:
      alertype: domain
      severity: '严重'
    annotations:
      description: "[报警]:({{ $labels.project }}){{ $labels.env }}_{{ $labels.name }}:站点无法访问\n>站点URL地址:{{ $labels.instance }}"

  - alert: 站点状态异常
    expr: (probe_success == 0 and probe_http_status_code > 499) or probe_http_status_code == 0
    for: 1m
    labels:
      alertype: domain
      severity: '警告'
    annotations:
      description: "[报警]:({{ $labels.project }}){{ $labels.env }}_{{ $labels.name }}:站点状态异常:{{ $value }}\n>站点URL地址:{{ $labels.instance }}"

  - alert: 站点耗时过高
    expr: probe_duration_seconds > 0.5
    for: 2m
    labels:
      alertype: domain
      severity: '警告'
    annotations:
      description: "[报警]:({{ $labels.project }}){{ $labels.env }}_{{ $labels.name }}:当前站点耗时:{{ $value | humanize }}s\n>站点URL地址:{{ $labels.instance }}"
node_rules.yml
groups:
- name: containerDown
  rules:
  - alert: 容器异常
    expr: container_tasks_state{name="nginx",state="running"} != 0
    for: 10s
    labels:
      user: root
      severity: erroring
    annotations:
      summary: "服务名:{{ $labels.alertname }}"
      description: "容器: {{ $labels.name }} 异常停止"
模版文件
templates.tmpl
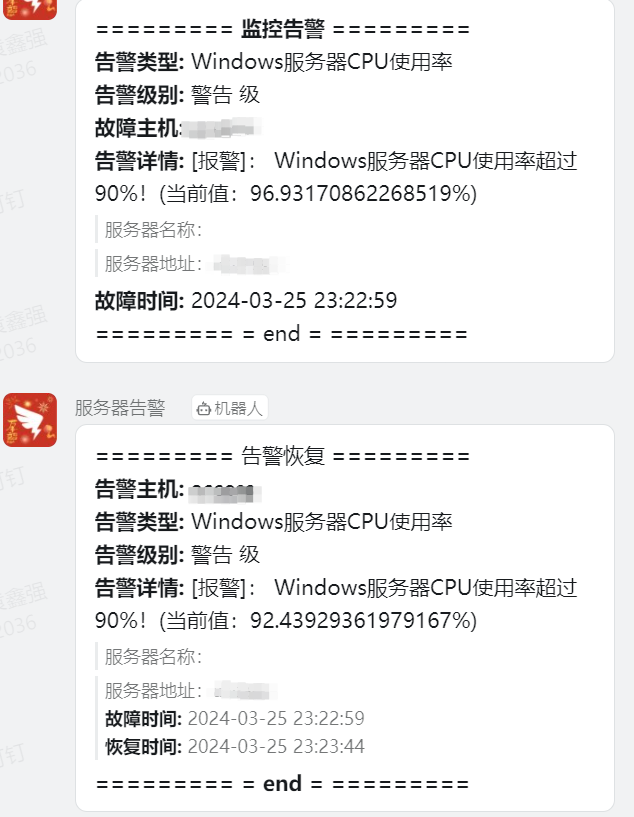
{{ define "dingding.to.message" }}

{{- if gt (len .Alerts.Firing) 0 -}}
{{- range $index, $alert := .Alerts -}}

=========  **监控告警** =========

**告警类型:**    {{ $alert.Labels.alertname }}
**告警级别:**    {{ $alert.Labels.severity }} 级
**故障主机:**    {{ $alert.Labels.instance }} {{ $alert.Labels.device }}
**告警详情:**    {{ $alert.Annotations.message }}{{ $alert.Annotations.description}}

**故障时间:**    {{ ($alert.StartsAt.Add 28800e9).Format "2006-01-02 15:04:05" }}
========= = end =  =========
{{- end }}
{{- end }}

{{- if gt (len .Alerts.Resolved) 0 -}}
{{- range $index, $alert := .Alerts -}}

========= 告警恢复 =========
**告警主机:**    {{ .Labels.instance }}
**告警类型:**    {{ .Labels.alertname }}
**告警级别:**    {{ $alert.Labels.severity }} 级
**告警详情:**    {{ $alert.Annotations.message }}{{ $alert.Annotations.description}}
**故障时间:**    {{ ($alert.StartsAt.Add 28800e9).Format "2006-01-02 15:04:05" }}
**恢复时间:**    {{ ($alert.EndsAt.Add 28800e9).Format "2006-01-02 15:04:05" }}

========= = **end** =  =========
{{- end }}
{{- end }}
{{- end }}
五、调试
5.1 调试步骤
5.1.1 创建对应目录,拷贝对应配置文件到各自文件夹
5.1.2 修改配置文件
新建钉钉监控群,新建自定义机器人,获取access_token

修改prometheus.yml里面监控地址,引入文件路径等配置。
docker-compose up -d启动项目
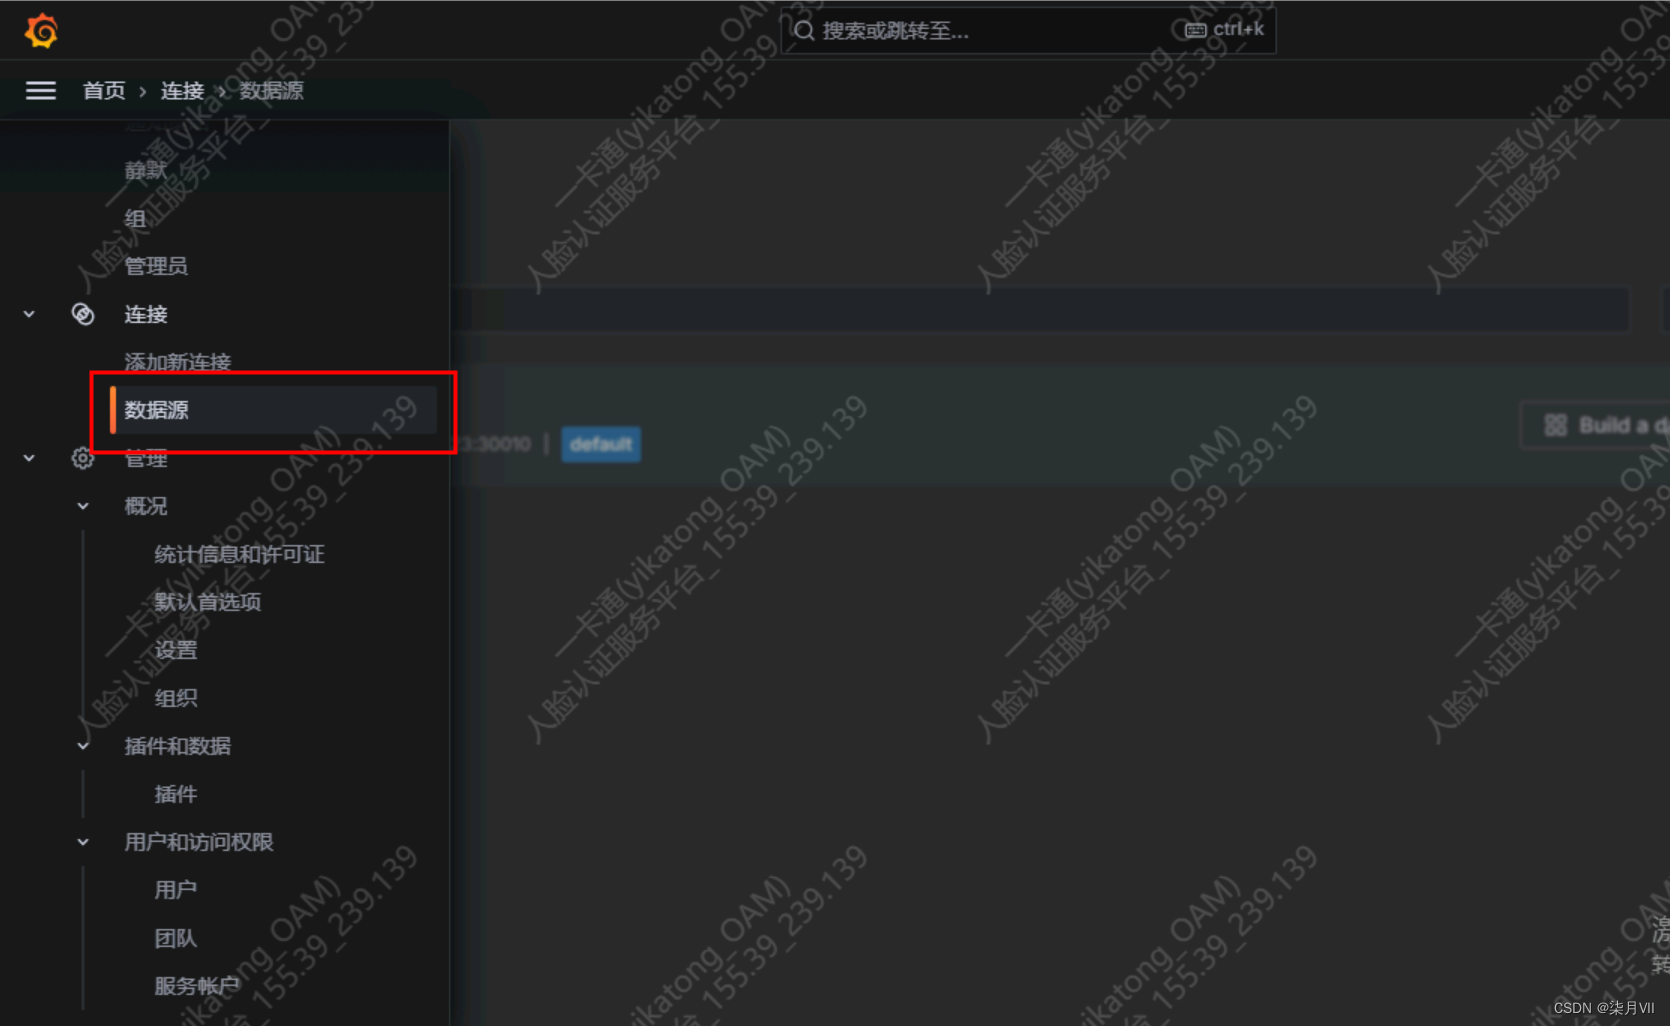
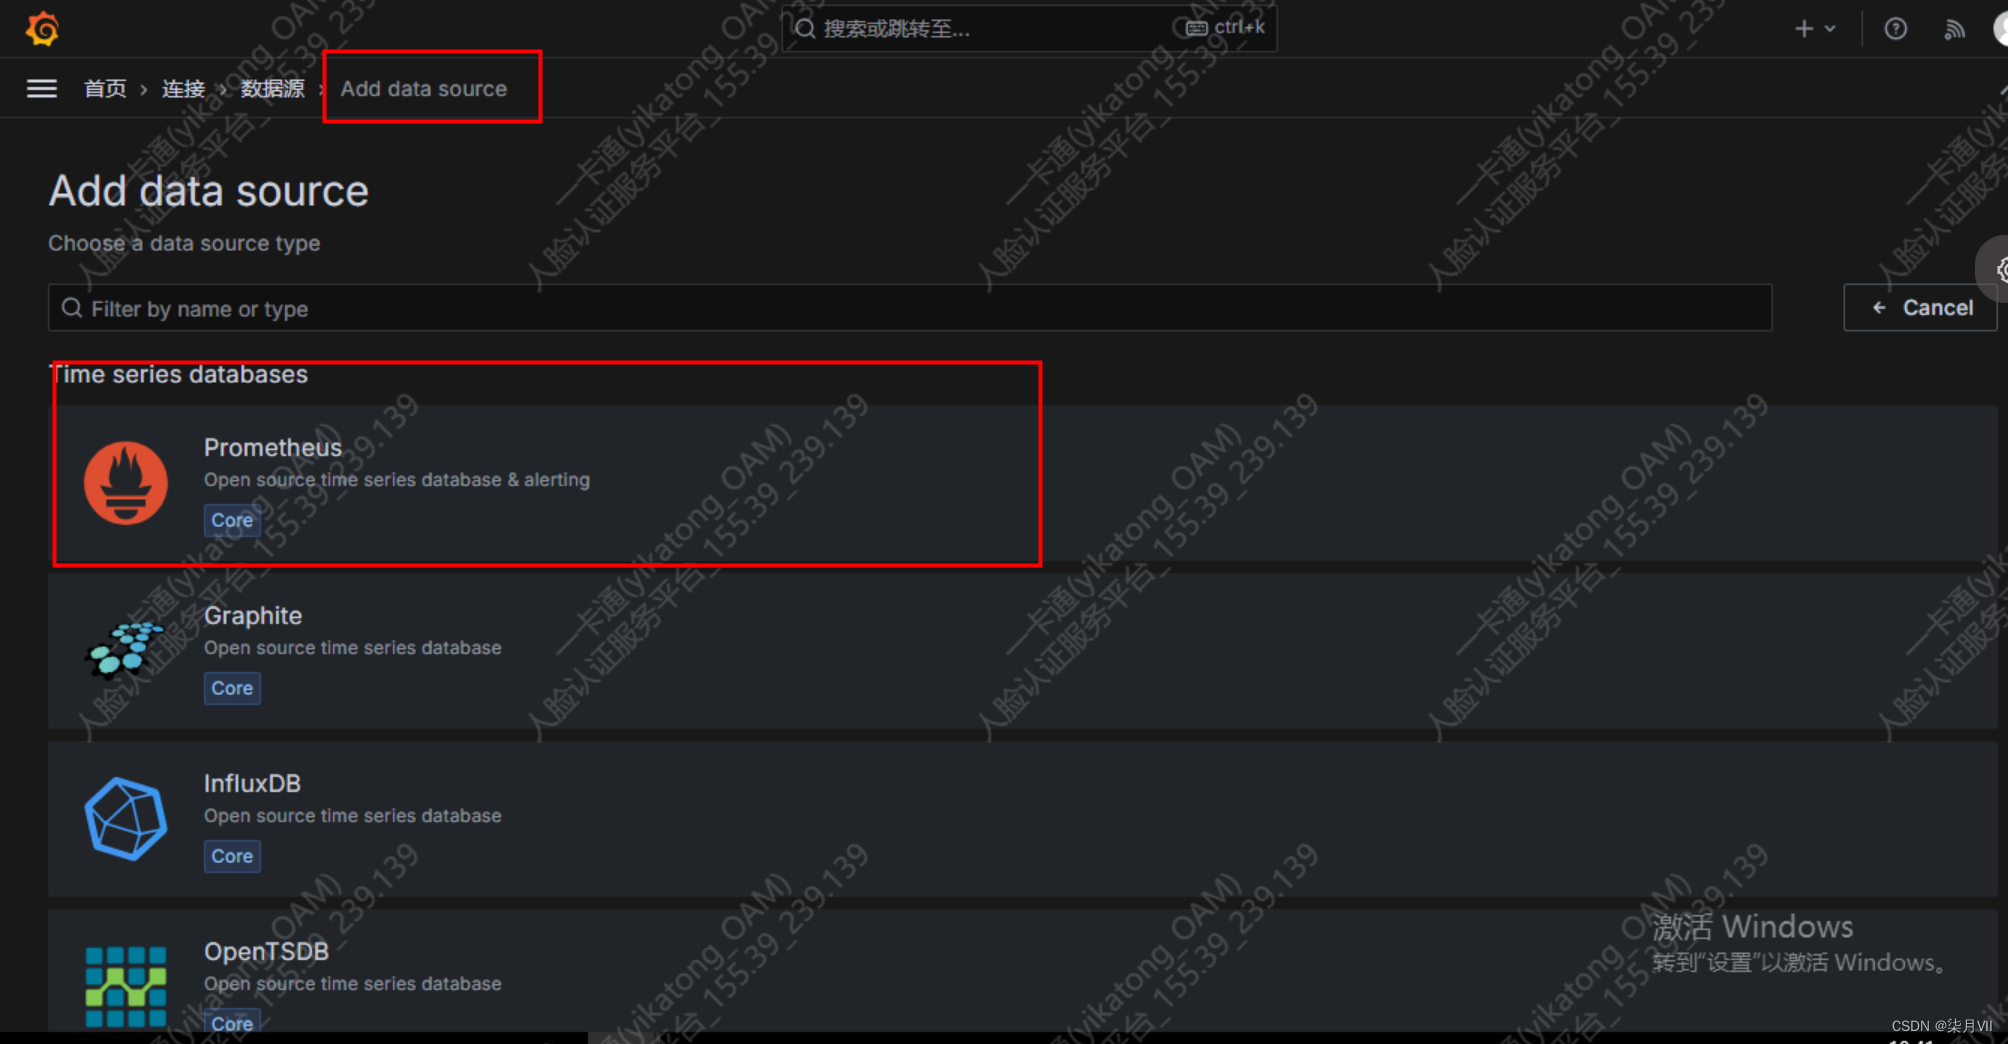
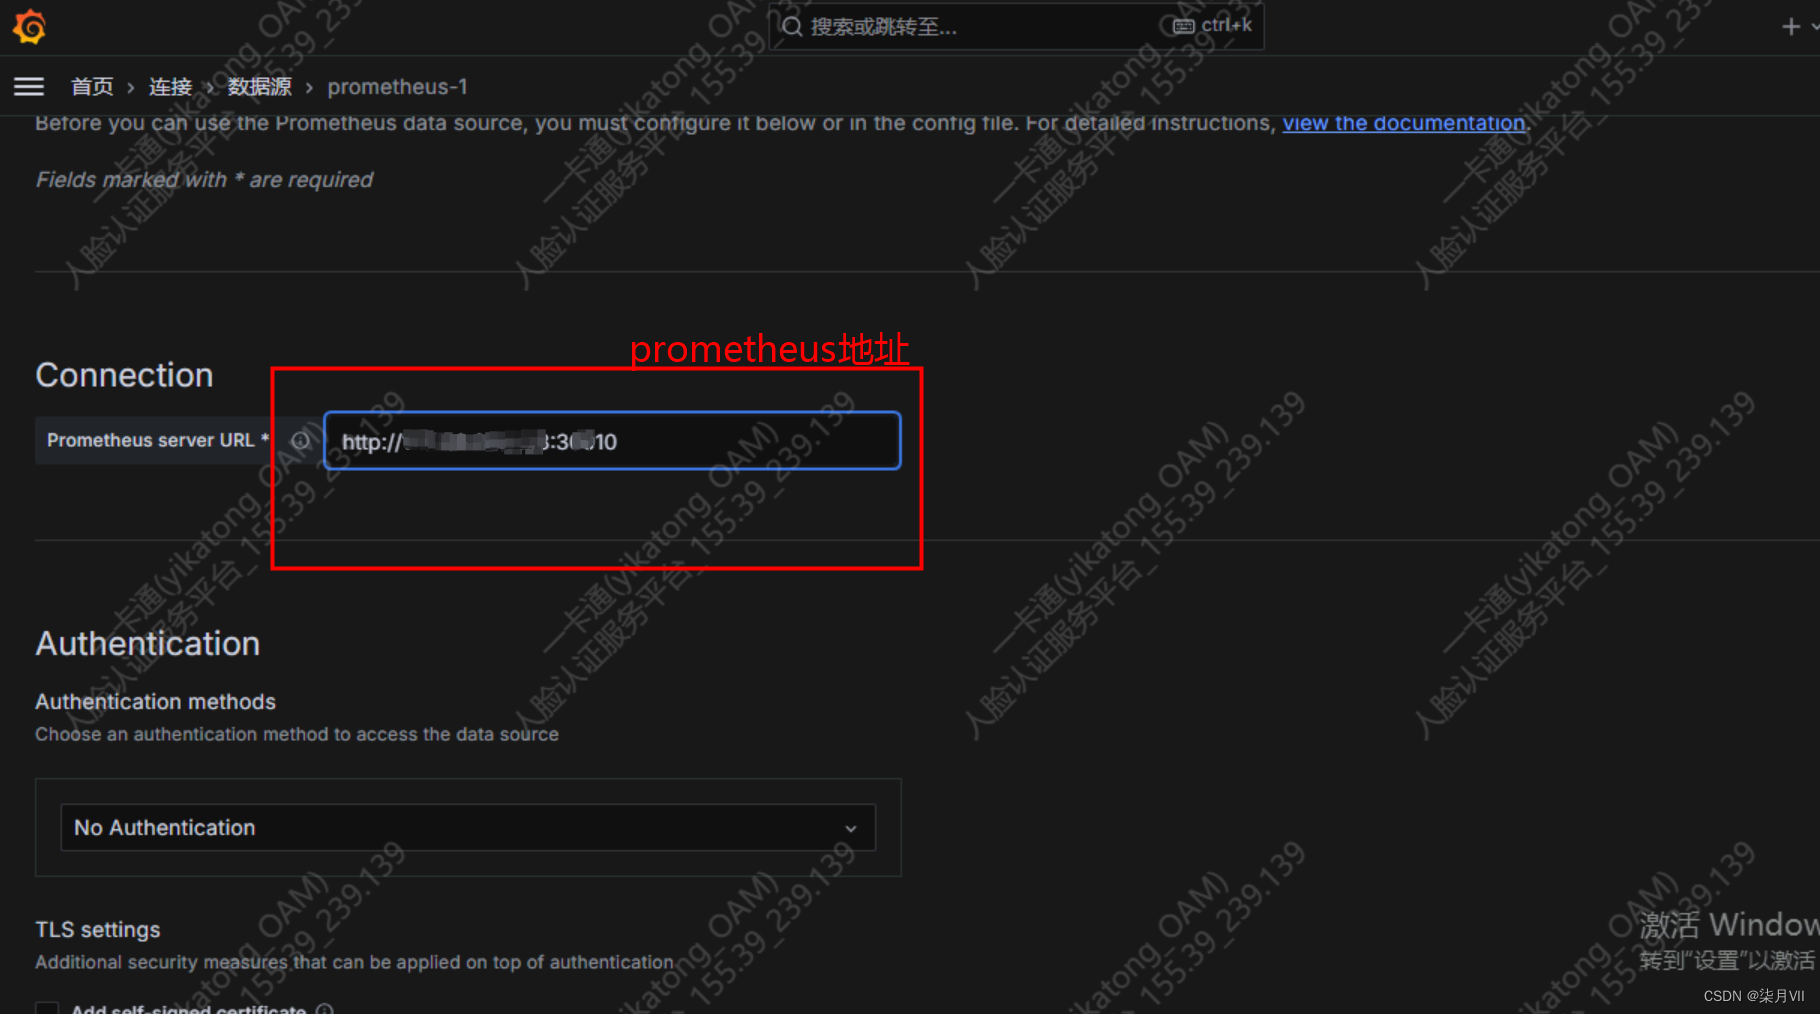
5.1.3 Grafana配置
新建数据源,类型选择prometheus
5.1.4 Grafana常用监控模版
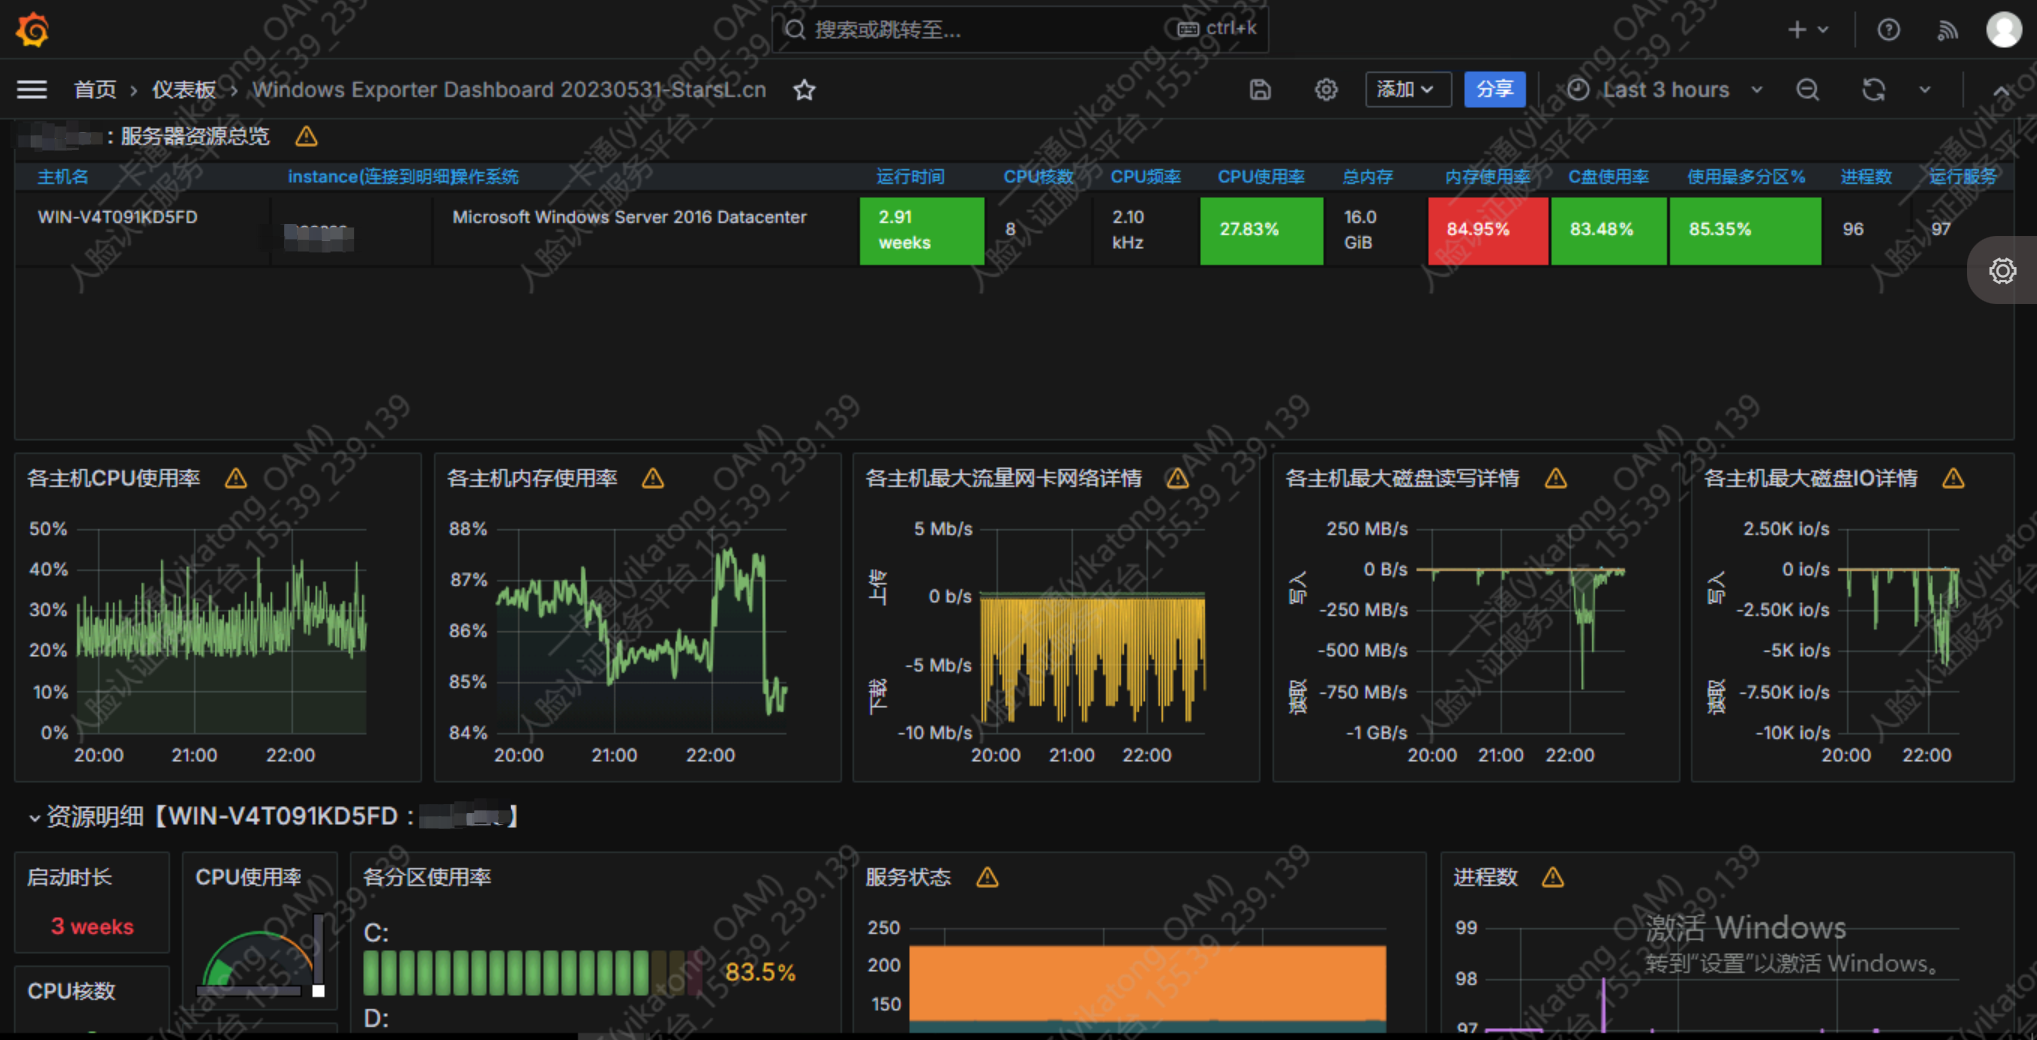
windows监控Dashboard:10467
web监控Dashboard:9965
docker监控Dashboard:14282
linux监控图表Dashboard:1860
Linux监控Dashboard:8919
5.2 钉钉不发送告警排查
-
检查钉钉
access_token是不是正确,服务器能不能访问钉钉接口 -
检查prometheus页面alerts是不是有告警信息
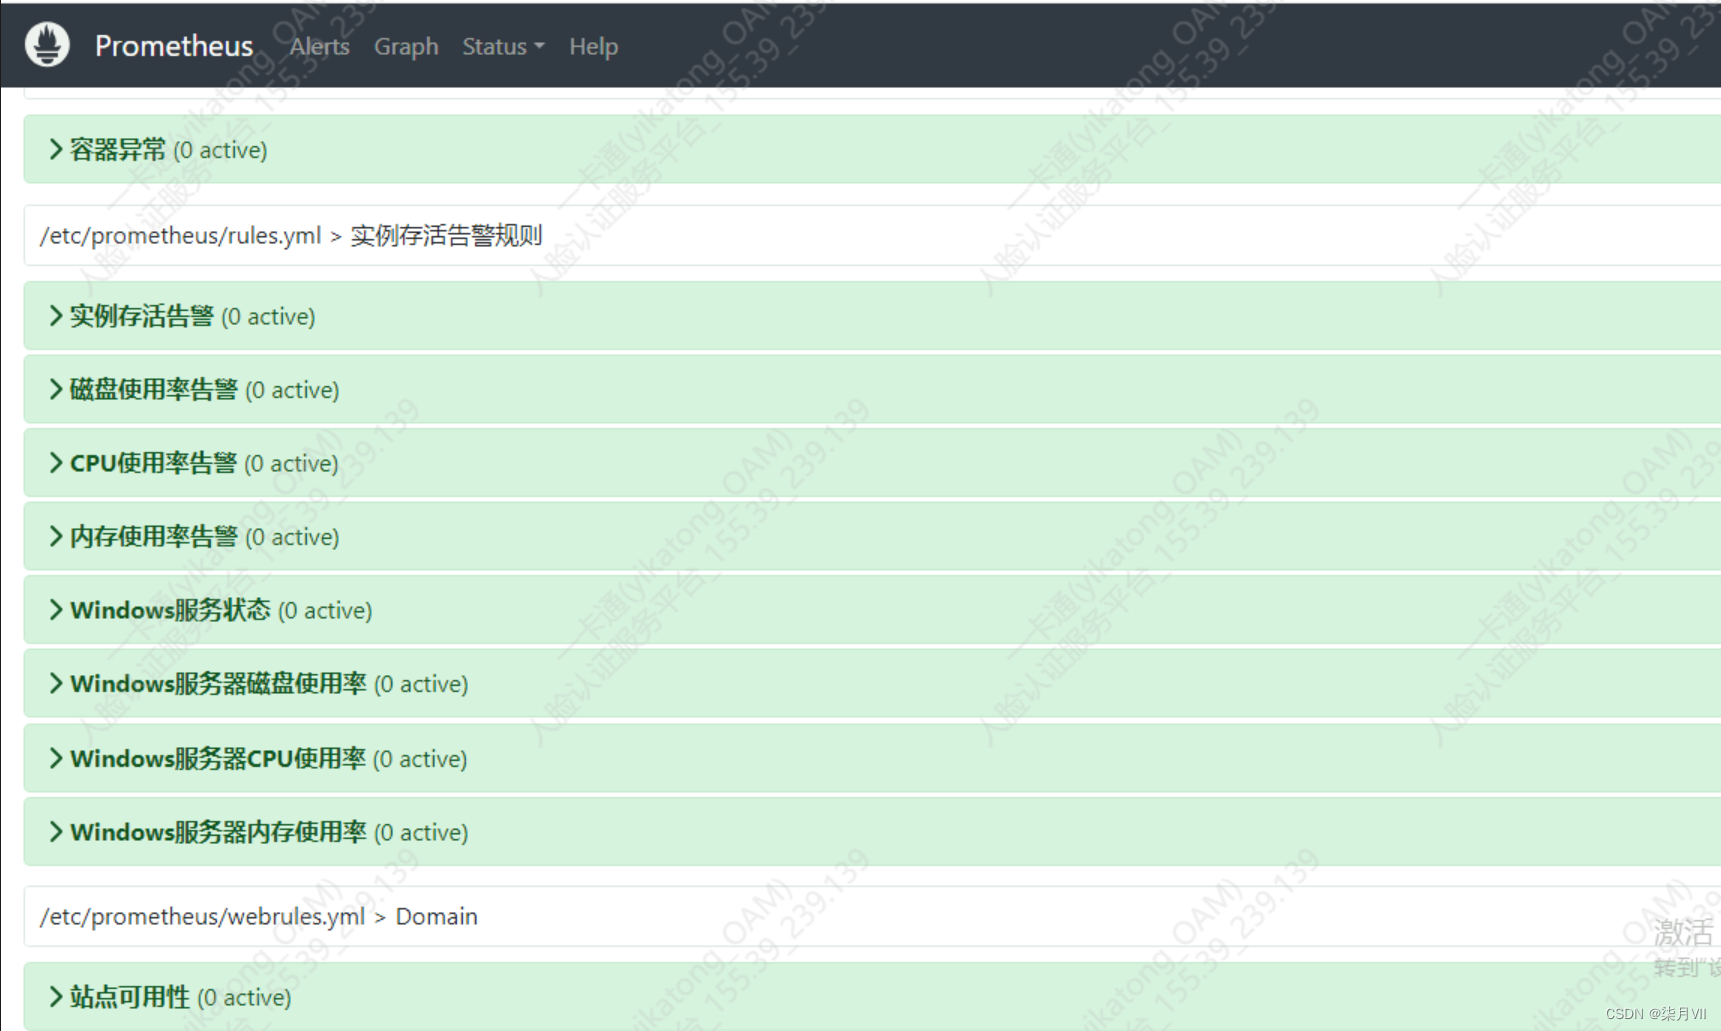
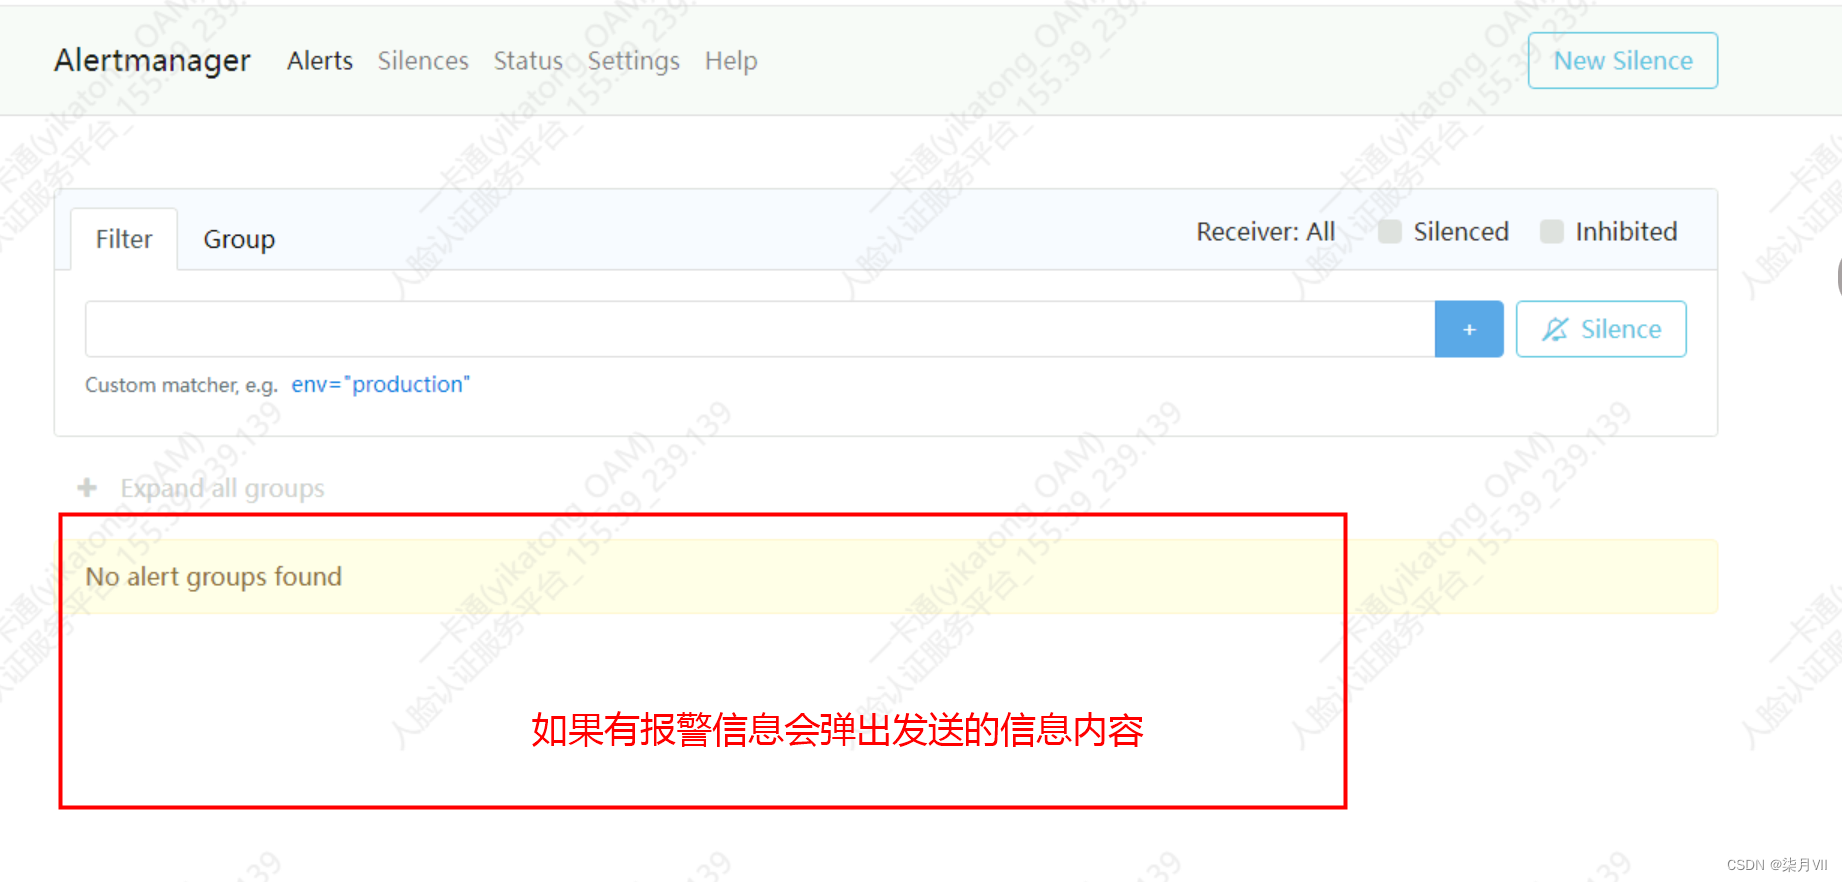
-
检查altermanager页面有没有发送信息弹出
5.3 windows_exporter安装
修改下面windows_exporter.exe路径,执行该命令,生成services服务,方便管理
sc create windows_exporter binpath= "C:\soft\winodws_exporter\windows_exporter-0.25.1-amd64.exe" type=own start=auto displayname= windows_exporter
六、总结
整体流程的核心在于prometheus,其他作为采集器的node_exporter、blockbox、cadvisor都需要在prometheus配置文件里面配置,dingtalk+alertmanager这两个是结合起来用的,dintalk配置文件配置钉钉机器人access_token的地址与密钥,altermanager配置dingtalk的访问地址,Grafana里面新建prometheus的数据源即可,import导入对应dashboard展示数据即可。